
SFRC Tension & Fibre Pullout
Background
In the available literature, direct tension tests of fibre reinforced concrete utilising randomly oriented fibres have proved to be difficult to successfully undertake with a reasonable level of accuracy and repeatability.Epoxy bonding of fibre reinforced concrete cylinders to loading platens with either rigid and/or spherical end couplings of platens to the testing machine is considered to provide reliable and reproducible results in terms of both ultimate tensile strength and post-crack behaviour of samples. Other forms of epoxy bonding of thin rectangular section specimens via double shear steel connections to testing machine platens have been tried with more limited success.
The laboratory resources and equipment available for the current program of tests precluded use of epoxy bonded specimens (to platens) and restricted applied ultimate tensile loads to 50kN. This load limit suggested a maximum specimen cross-sectional area of approximately 100 mm x 100 mm, which (in turn) suggested a maximum fibre length of 30 to 35 mm to ensure random orientation.
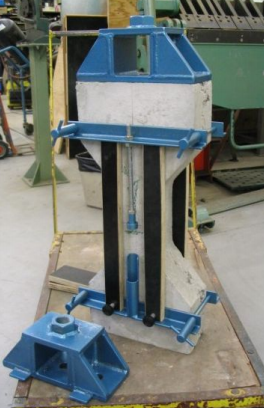
In light of these restrictions and to provide for either rigid or ‘semi-rigid’ coupling of specimens via loading platens to the testing machine loading frame/head, a ‘dogbone’ profile specimen was devised utilising standard cast iron ferrules in direct tension.
 |
 |
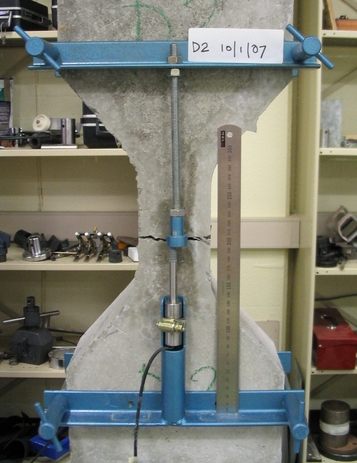
| Tension test "Dogbone"
specimen with platens and LVDT clamps |
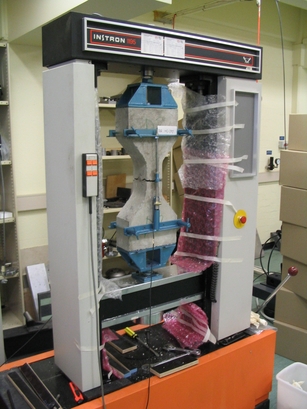
Instron 1195 testing machine with specimen under test |
Fibres tested
The fibre reinforced concrete testing program is centred on fibres that are commercially available. Contact with suppliers provided a wide range of fibre types for testing. The restriction of fibre length to 30/35mm limited the current testing program to just three fibres, described hereafter as “spade end”, “hook end” and “waffle” fibre(s).The selected fibres each have a different aspect ratio, however all were employed at the same dosage rate of 50 kg per m3 of concrete. Fibre count at a tensile failure surface will essentially differ between the three fibres tested as individual fibres have different sizes and weights.
Test program
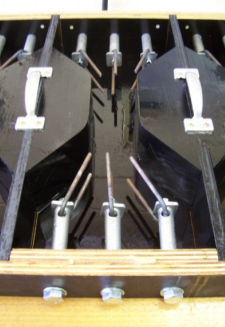
One concrete mix with 28 day nominal 50 MPa compressive strength, 9 mm (maximim) large aggregate size, sand with a fineness modulus of 2, and a water/cement ratio producing a slump of 90 to 110mm was employed for all specimens. Timber form-ply moulds were constructed to permit the casting of five specimens side by side with six ferrules. To increase the tensile load capacity, 6 mm diameter steel hairpins were inserted through the ferrule ends. The resulting tensile test section at the midpoint of each specimen was 200 mm long with an 80 mm x 110 mm cross-section.In addition to the three sets of five fibre reinforced specimens, a further set of five plain concrete specimens was cast as a control set.
To record the pre and post crack extensions of specimens, a pair of LVDT 10 mm (maximum range) displacement transducers were mounted at the front and rear of the specimen and clamped to the specimen during the test. The gauge length over which these transducers operated was 385 mm. Tensile load applied to a specimen was recorded by the 50 kN load cell incorporated onto the INSTRON 1195 testing machine. All data during testing was processed by an analogue-digital card and stored on a PC.
Specimens were tested at the lowest displacement / time rate provided by the INSTRON, that is, 0.5 mm per minute to permit the collection of meaningful load/displacement data in the exceptionally stiff pre-crack phase of a test, and in an attempt to collect data in the crack propagation phase for fibre reinforced specimens. Data files were imported into a spreadsheet for processing and final presentation.
 |
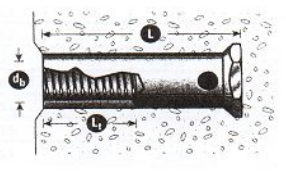 |
| Specimen mould pre-casting | Typical ferrule |
 |
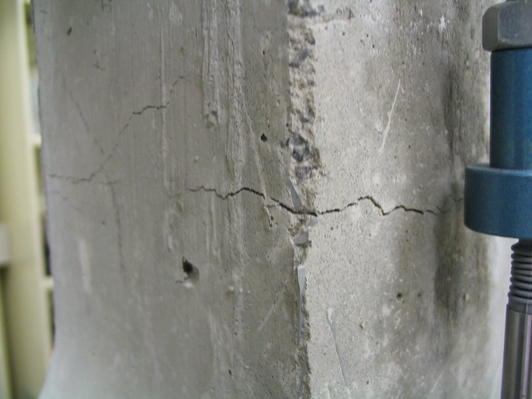 |
| LVDT clamped to specimen |
Crack initiation |
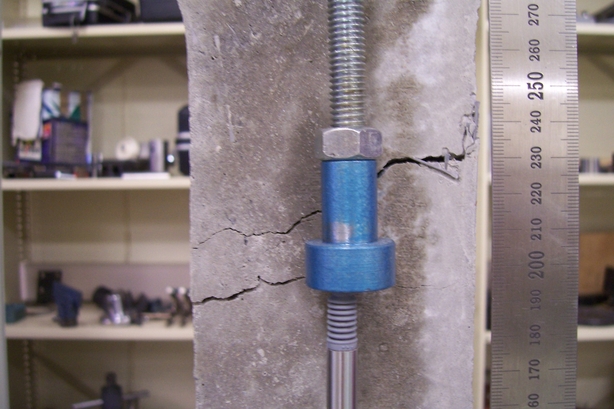 |
| Post crack phase - showing LVDT transducer probe and bearing pin |
Outcome of test program
Of the 15 SFRC samples only 11 were judged as having a suitable and full set of load –displacement data. Typical plots for each of the three fibre types are shown below. Eventually eight plain concrete specimens were produced and tested. Of these only 6 were judged as having meaningful test results. The range of unforeseen circumstances limiting the available data included recording PC/data acquisition malfunctions (2), damage to specimen before/during testing (2) and incomplete data sets due to dislodgement of displacement transducer(s) after a primary tension crack had formed (2).During testing, attempts were made to modify the way samples were mounted in the loading frame to investigate the effect of fully rigid through to partially rigid specime n ends . Initially samples were seated under their own weight on the lower platen and then bolted finger tight. Finally the upper platen was lowered and with some looseness of the interface between platen and sample, the bolts were finger tightened. This represents a fixed base (end) with partially fixed upper end. Later (75%) of tests were conducted by suspending the specimen under its own weight from the top platen, then adjusting all three top bolts to swing the sample into alignment with lower platen, then finally to insert the three lower platen bolts and tighten all finger tight whilst maintaining a gap of 2 to 4 mm at both top and base of specimen. This represents partially fixed/free ends at both top and bottom of a specimen. There is a penalty with this arrangement and it is that after cracking – the upper and lower segments of the specimen were reasonably free to swing causing subsequent displacements to be recorded less smoothly. The loss of data in two specimens was due to this effect, that is, dislodgement of the displacement transducer mountings.
Spade End Fibre
Ultimate tensile load(UL) / nominal ultimate tensile strengthThe mean UL and nominal ultimate tensile strength were 25.6 kN and 2.9 MPa respectively.
This is almost identical to the plain concrete specimen values of
25.5 kN and 2.9 MPa.
Initial crack width (Post UL)
The mean initial crack width measured was 0.2 mm
Post-crack load(PCL)
The mean PCL was 17.8 kN representing 69.4% of the UL and a mean drop of only 7.8 kN.
The mean PCL was 17.8 kN representing 69.4% of the UL and a mean drop of only 7.8 kN.
Post-crack energy absorption
From zero to a total displacement of 5.2 mm the mean value was 37.1 Joules and to 7 mm it was 40.8 Joules.
The mean UL and nominal ultimate tensile strength were 23.8 kN and 2.7 MPa respectively.
This is slightly less than the plain concrete specimen values of 25.5 kN and 2.9 MPa.
From zero to a total displacement of 5.2 mm the mean value was 37.1 Joules and to 7 mm it was 40.8 Joules.
Hook End Fibre
Ultimate tensile load(UL) / nominal ultimate tensile strengthThe mean UL and nominal ultimate tensile strength were 23.8 kN and 2.7 MPa respectively.
This is slightly less than the plain concrete specimen values of 25.5 kN and 2.9 MPa.
Initial crack width (Post UL)
The mean initial crack width measured was 0.3 mm
The mean initial crack width measured was 0.3 mm
Post-crack load (PCL)
The mean PCL was 15.5 kN representing 64.5% of the UL and a mean drop of only 8.3 kN.
The mean PCL was 15.5 kN representing 64.5% of the UL and a mean drop of only 8.3 kN.
Post-crack energy absorption
From zero to a total displacement of 5.2 mm the mean value was 38.5 Joules and to 7 mm it was 43.5 Joules.
Waffle (corrugated) Fibre
Ultimate tensile load(UL) / nominal ultimate tensile strengthThe mean UL and nominal ultimate tensile strength were 24.4 kN and 2.8 MPa respectively.
This is slightly less than the plain concrete specimen values of 25.5 kN and 2.9 MPa.
Initial crack width (Post UL)
The mean initial crack width measured was 0.8 mm
Post-crack load (PCL)
The mean PCL was 1.7 kN representing only 7% of the UL and a mean
drop of 23.1 kN.
Post-crack energy absorption
From zero to a total displacement of 5.2 mm the mean value was 7.3 Joules and was not measured to 7 mm as most specimens had separated by that stage.
From zero to a total displacement of 5.2 mm the mean value was 7.3 Joules and was not measured to 7 mm as most specimens had separated by that stage.
 |
 |
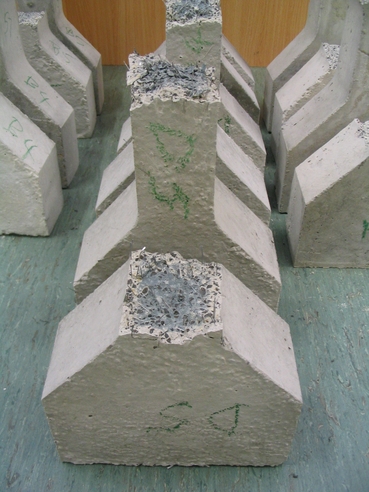
| Specimens after testing.
Note: failure locations varied along the length of the necked zone |
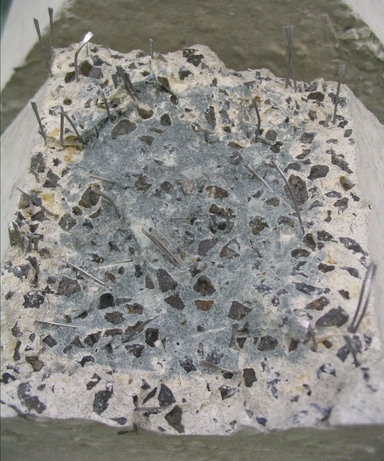
Surface after failure -
showing a spade end fibre mix. Hook end samples similarly showed fibres. Waffle samples showed no fibres as they had all snapped |
Comparative assessments
As suggested in the literature and observed in these tests, ultimate tensile loads of specimens are unaffected by the presence of fibres in the concrete matrix. For all specimens tested the mean ultimate tensile load was between 24 and 25 kN representing an ultimate tensile strength of between 2.7 and 2.9 MPa. This is contrasts well with the limited (3 only) 100 mm diameter cylinder compression tests available having a mean 28 day strength of 58.9 MPa.Typical load-displacement plots show strong similarities between the post-crack behaviour of the spade and hook end fibres in terms of significant PCL values between 65 and 70% of the specime n ultimate load capacity, small crack widths in the order of 0.2 to 0.3 mm and a progressive and slow reduction in the PCL value over 8 or 9 mm of total crack displacement. Visual examination of typical failure surfaces for these fibres show that fibre pullout is the mode of failure once the primary tension crack has occurred. In the case of hook end fibres, plastic straightening of the ‘hook end’ is clearly evident. Energy absorption capabilities for specimens are in the vicinity of 37 to 43 Joules.
Waffle fibres present a totally different outcome . First there is there is almost no PCL value, initial specimen cracks are significantly larger at 0.8mm and thereafter there is an erratic and rapid decline in PCL value to near nil at less than 4 to 5 mm of total crack displacement. Visual examination of typical failure surfaces shows little evidence of fibre pullout as fibres, even at high incidence angles to the applied load direction, remain embedded in the concrete matrix and fail. Energy absorption capability is low at no more than 7 Joules. Given that most waffle fibres fracture, control over the degree of relative lateral displacement of the cracked surfaces is minimal and unlike that provided by both spade and hook end fibres.
For both spade and hook end fibre specimens, a fibre counts at crack surface suggest a possible correlation with PCL worth further investigation.
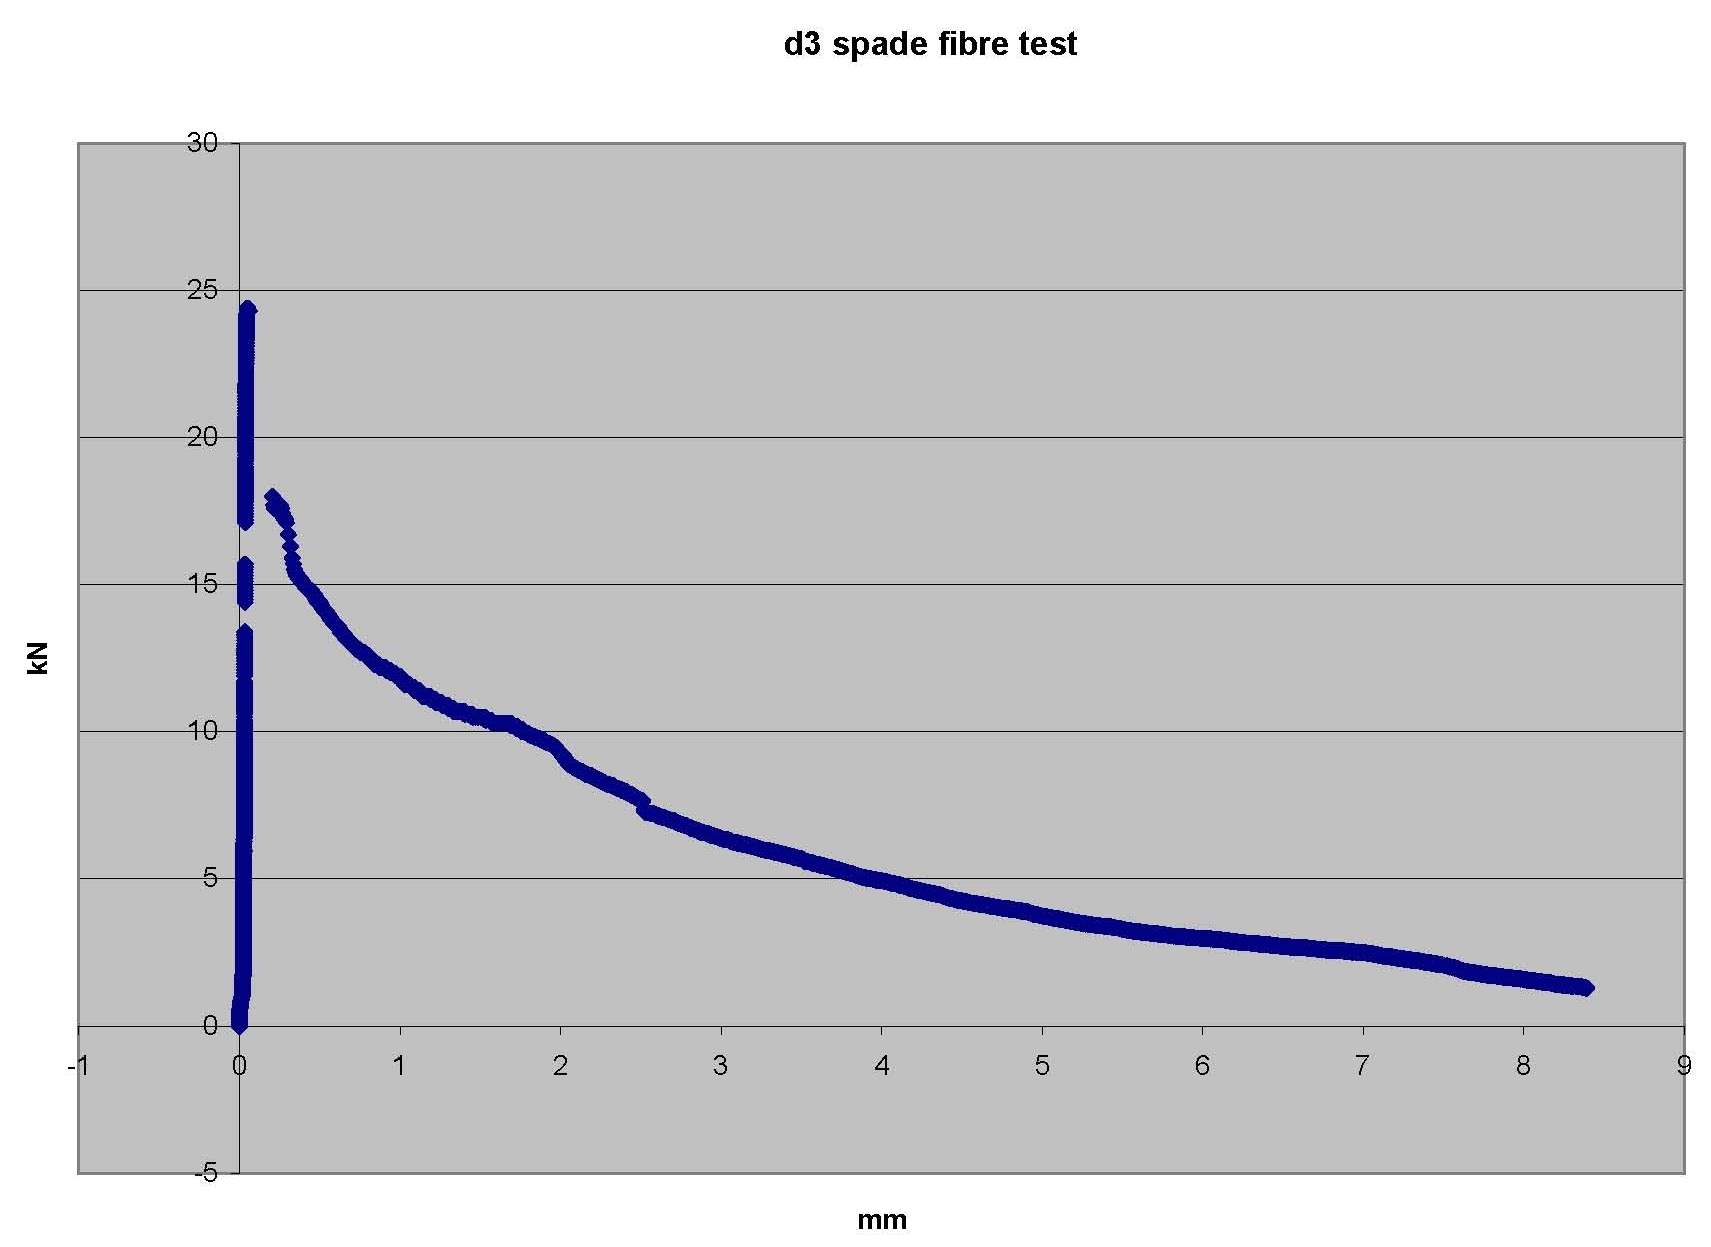 |
| Typical Spade End Fibre - Load displacement plot |
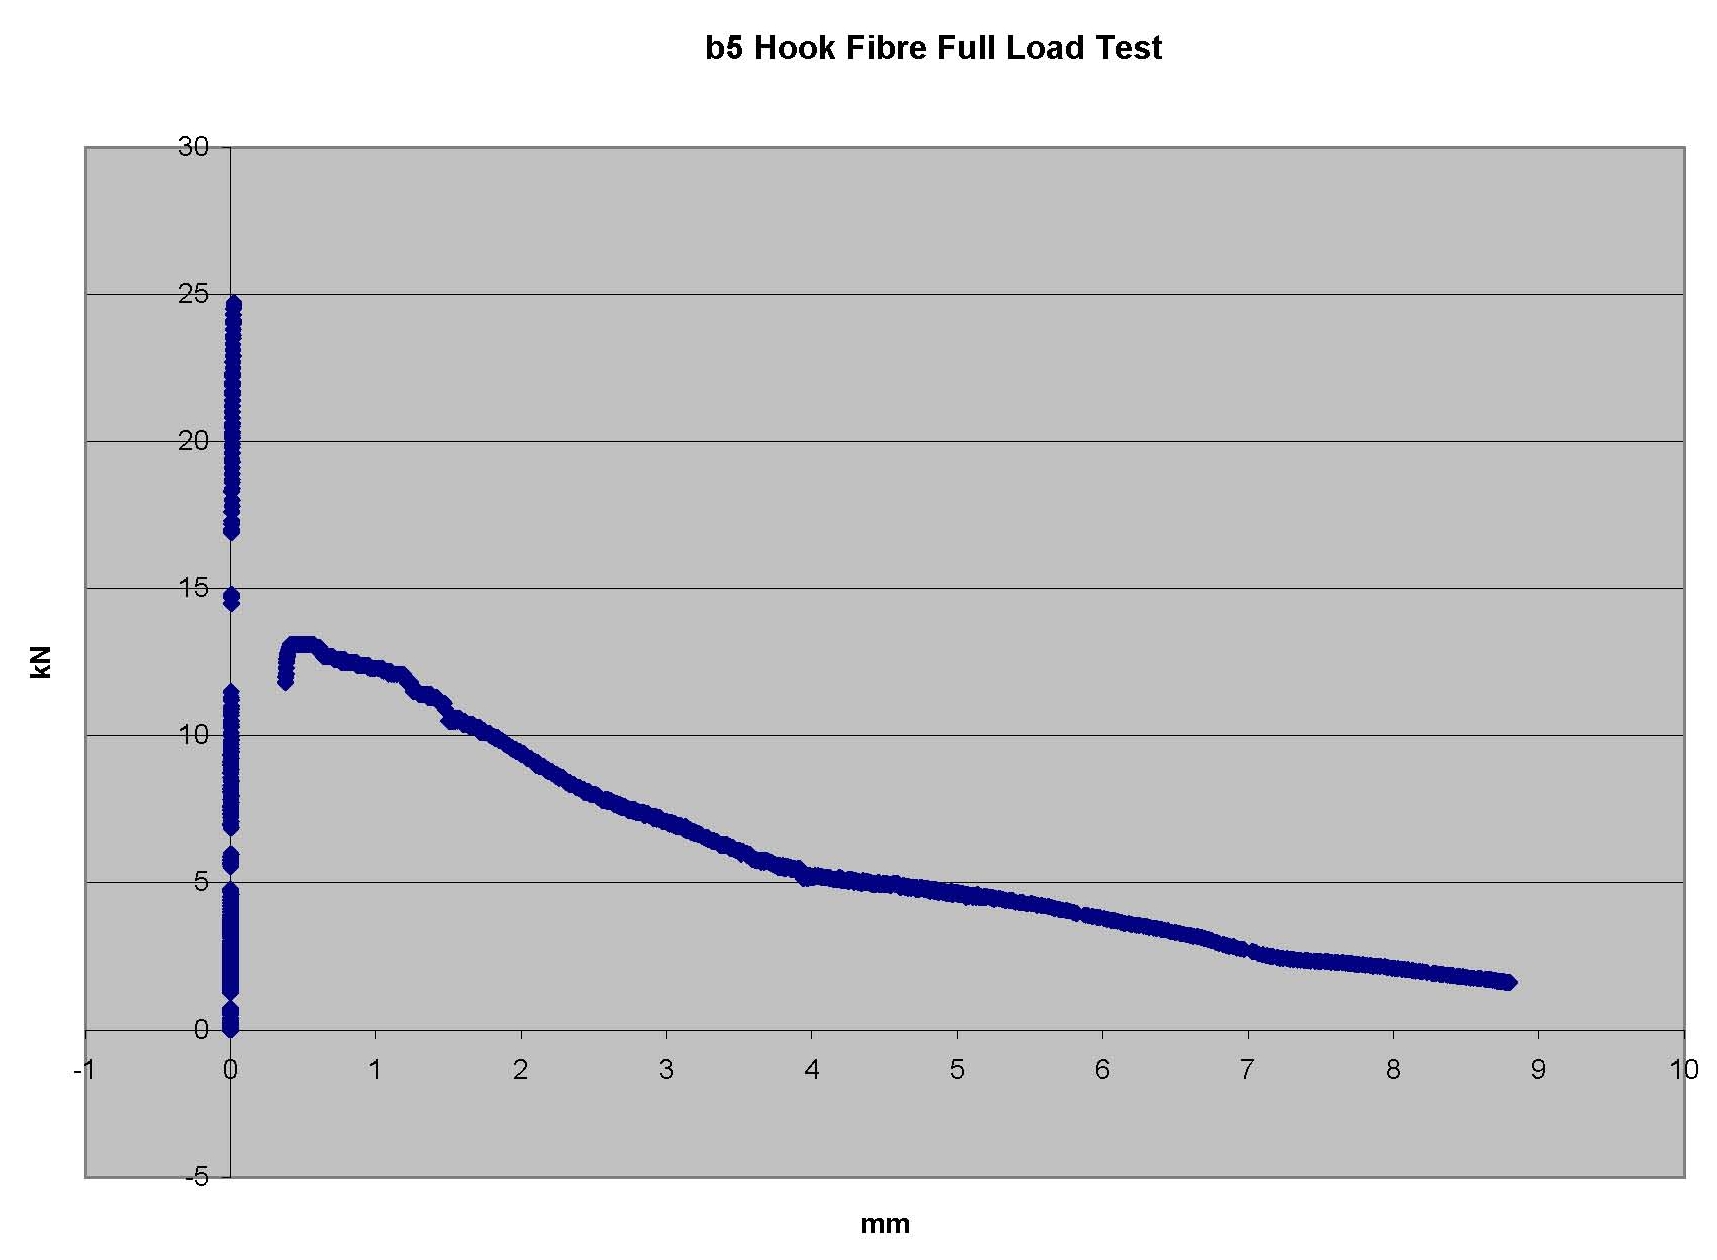 |
| Typical Hook End Fibre - Load displacement plot |
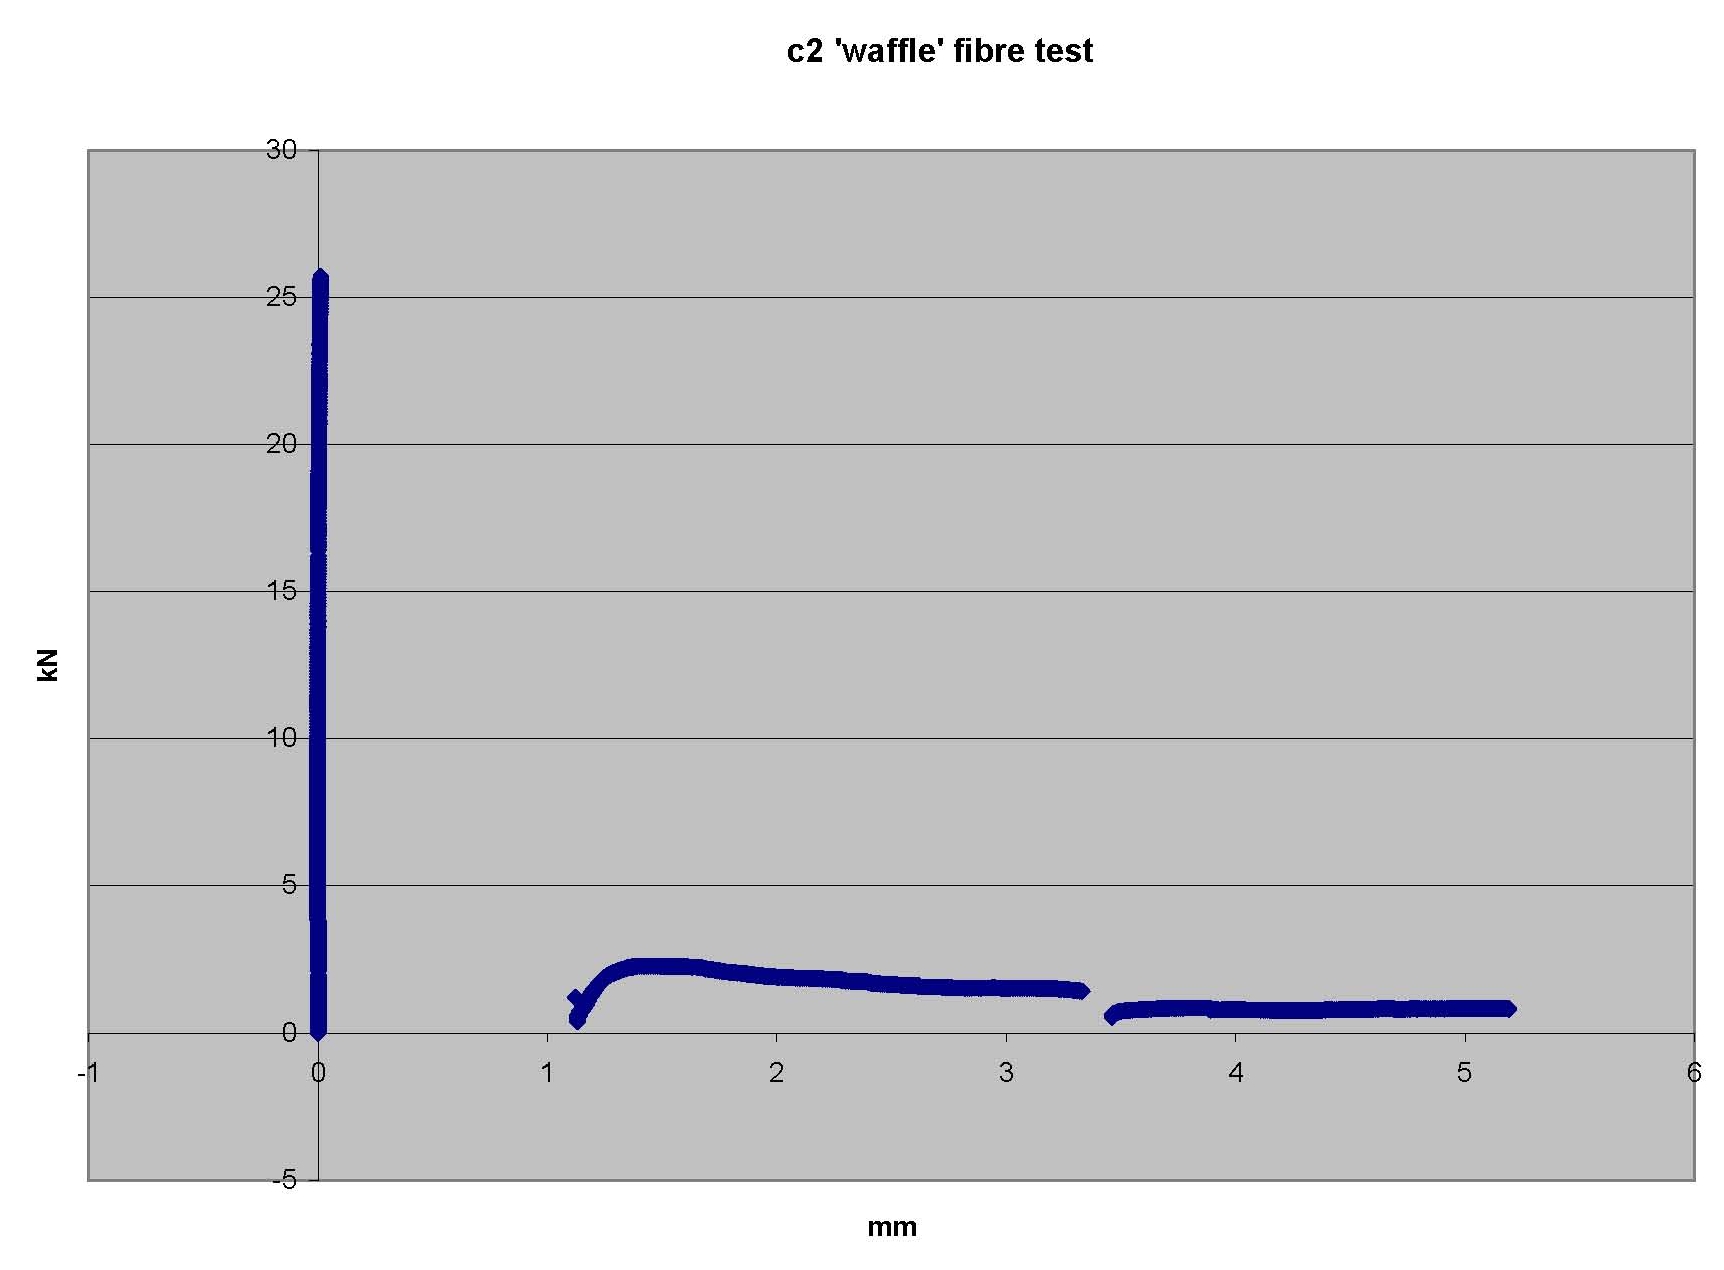 |
| Typical Waffle Fibre - Load displacement plot |
Tensile capacity and fibre pullout
The plots from the direct tension tests provide force at displacements from zero until complete failure of the specimens. This information can used to calculate tension in the steel fibre immediately after the concrete cracks. The plots show that fibre tension decreases with crack opening. This is to be expected as fibre pull out reduces their effectiveness until they have been completely pulled out from the concrete. This discussion is limited to the spade and hook end fibres as the waffle fibres simply snap at small crack openings and become ineffective.The fibres are randomly dispersed through the concrete matrix, in both position and orientation. A fibre effectiveness factor of 0.3 due to three dimensional orientation has been adopted and is in line with values suggested by other researchers.
The plots show that after the initial concrete failure there is tension capacity from about 0.2 mm for spade end fibres and 0.3 mm for hook end fibres. The average tension capacity is 69% and 65% of the concrete capacity for the spade end and hook end fibres respectively. As there is an abrupt “arrest” in tension capacity after rapidly falling away from the initial peak capacity, it is reasonable to say the residual post-crack tension is due to fibres acting alone with no tension capacity in the fractured concrete.
The average measured concrete tension across all samples was 24.8 kN, which equates to an average tensile stress in the concrete at point of fracture of 2.82 MPa. This can be compared with limit state tensile capacity that is calculated with reference to design codes. Codes tend to provide a formula where tensile capacity is calculated as a proportion of concrete compression strength – usually around 7% to 10%.
The following formula for calculating tensile strength tends to provide a tensile stress (capacity) in the mid-range of many design codes including Eurocode, ACI and codes in other countries.
From Eurocode EN1992-1-1:2004 adopt

Where σct is concrete tensile capacity and σc is concrete compression strength.
Based on the nominal compression strength of 50 MPa, the calculated mean tensile strength is 3.8 MPa and the 5% fractile strength is 2.66MPa, which is similar to the tensile strength measured from the specimens. When using the measured compressive strength of 58.9 MPa the mean and 5% fractile tensile strengths are 4.09 MPa and 2.86 MPa compared with the measured tensile strengths at fracture of 2.7 MPa to 2.9 MPa. For this series of tests the 5% fractile tensile strength is a good indicator of direct tension.
Post crack tensile stress in the fibres can be calculated using:

Where
◦ σft is the post crack stress
◦ Pft is the measured tension force
◦ A is the cross-sectional area of the specimen
◦ 0.3 is a measure of fibre effectiveness due to 3-D orientation.
◦ ηVOL is steel fibre proportion of matrix (volume).
◦

◦ η is steel fibre dosage kg/m3
◦ ρs density of steel 7850 kg/m3
◦ στ = fibre stress
Re-arranging;

Using the measured post-crack tensile capacities, the fibre stress στ is 1058 MPa for the spade end fibre and 922 MPa for the hook end fibre.
This can be compared with the manufacturers nominated fibre tensile strengths of 1150 MPa and 1300 MPa for the spade and hook end fibres respectively. Both fibres are performing at near optimal levels, with the spade end being a little more efficient. The end anchorage of each fibre is well suited to the fibre as the tensile stress exceeds 70% of the fibre strength.
Based on the results of this research it can be surmised that fibre pullout forces determine the post-crack tensile capacity of fibre reinforced concrete. Preliminary testing by the author indicates there is a strong correlation between fibre pullout and post-crack tension capacity. Further work comparing individual fibre pullout forces with dogbone specimens using the same concrete strength and fibre type would enable post-crack tensile strength to be calculated in a relatively straightforward manner.
Fibre effectiveness will most likely vary with concrete strength. In addition to comparing fibre pullout with post-crack strength, as mentioned above, it would also be very useful to make the comparisons at varying concrete strengths.
Fracture Mechanics - Softening Curve
A bi-linear softening curve is indicated by the plots and can be adopted to model concrete matrix behaviour when the concrete matrix passes through the peak stress capacity. Three points on the curve can be calculated. Concrete tensile strength (point 1) and post-crack tensile strength (point 2) are calculated as described above.The maximum crack width (point 3) at which there is no more tensile capacity will depend on the fibre type and length. Hook-end fibres straighten as they are pulled out of the concrete matrix. Once the “kinks” have been straightened, the fibres have very little resistance to being pulled out. Spade end fibres tend to maintain the same pullout force until the last few millimetres. Nevertheless it would be prudent to adopt a maximum crack width of 15% of the fibre length. Any crack opening beyond this will be quite ineffectual.
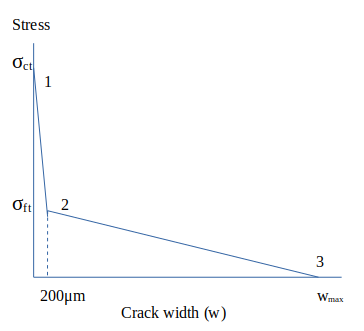
Bi-linear softening curve
Using the fracture mechanics approach, the bi-linear softening curve provides the fracture energy and characteristic length which can be used to calculate a range of structural properties such as shear resistance.
Conclusion
This research has demonstrated the link between fibre type and the fracture mechanics method. More research is needed, as described above, however already based on the available information we have useful tools for design of steel fibre reinforced concrete structures. These design tools have been successfully used in a range of structures and we would be pleased to contribute to new structures and research initiatives.
Research Initiatives