
Shear Capacity using the Concrete Plasticity Method
As a material, steel fibers have been available to the construction industry for many decades. In recent years there have been significant improvements in understanding the properties that steel fiber can bring to concrete. It is now generally understood that steel fiber cannot replace the primary bending tensile capacity of steel reinforcement, whether conventional reinforcing bar or prestressing strands. Steel fiber can, however, improve non-flexural performance of concrete. Shear capacity of concrete is one example, and this paper includes shear tests of full scale bridge beams (T-beams) commonly used in Australia.
In the last couple of decades there have been numerous laboratory tests of laboratory scale beams and other castings attempting to determine suitable parameters. It is well understood that steel fibers, being widely and randomly dispersed throughout the concrete matrix, will cross cracks (particularly micro-cracks) as they occur in concrete. Fibers tend to take up tension across the cracks and redistribute stresses throughout the concrete matrix. Concrete splitting experiments in various forms have been conducted over many years with varying types and quantities of fiber in a variety of concrete mixes. Parra-Montesinos [1] has reported on a large number of shear tests conducted on steel fiber reinforced concrete (SFRC) beams by several researchers.
Several researchers have attempted to place a framework around shear in SFRC. A paper by Aoudeet et al [2] provides a good summary of proposed equations to predict shear capacity in SFRC. This paper has been based on a review by Minelli et al [3] who indicated the approaches fall into two broad categories. The first is one where fibers provide an additional shear contribution, similar to the method adopted with conventional reinforced concrete beams where the concrete and steel contributions are simply added together to find the total shear capacity of the section. There are several models (mentioned in the paper) to calculate shear capacity of the fibers. The second is where fibers make an integral contribution to concrete capacity. Both approaches are based on developing empirical rules from laboratory testing. An example of the second approach is an equation proposed by Minelli and Plizzari [4], which provides an additional component to the equation in Eurocode 2 and has been adopted in the fib Model Code 2010.
There are two main problems with these approaches. First, while researchers use their best endeavours with the laboratory facilities at their disposal, it is not until some verification at the full-scale is completed before one can have confidence in applying these equations. Second, the equations are empirically developed to fit the available data from laboratory testing, which may not necessarily be applicable to the wide variety of beam sizes and shapes used in industry.
Part of the problem arises out of the very nature of the conventional methods used to determine shear capacity in concrete beams. The equations of all codes and virtually all reference texts in reinforced concrete not only “look” empirical, they largely are empirical. Most researchers have chosen to extend the empirical approach to SFRC and the result is usually a bigger empirical equation, such as the one published in the fib Model Code 2010 and considered in this paper.
Code formulae should be conservative, but the conservatism should be built into material safety factors and load factors. The underlying formula should be a reasonable predictor, within sensible tolerances, of actual structural capacity. Based on the beam test results on the following pages, the empirical formula in the fib Model Code is a poor predictor and sufficiently different from actual capacity so as to cast doubt on it’s value and usefulness.
It is possible to suggest there are currently three approaches. Matrix plus fibers adopts the empirically developed shear capacity of plain concrete and adds the fiber contribution with an empirical “fiber factor”. The second approach, treating SFRC a new material, uses material tests to try and quantify the improvement in shear capacity, which has led to the fib Model code formula. A third approach could broadly be characterised as non-empirical. Plastic methods, including those that incorporate the Variable Engagement Model (VEM) [6], would fall into this category.
In recent years there have been several investigations regarding plastic methods [13, 14, 15]. The authors generally recommend that a rational or semi-rational approach is warranted. Plastic methods have been rendered in various ways and seem to correlate better with test results.
The test beams in this experiment are full-scale to address the two main problems outlined above. Furthermore, the results are compared with a rational approach based on plastic methods in an attempt to develop an approach that can be used more broadly with confidence regarding the accuracy of predicted shear capacity. T-beams are precast prestressed (hence pre-tensioned) concrete beams that are fabricated throughout Australia to varying depth and top flange widths.
The flanges were not considered as part of the shear resisting section in the rationale approach for two reasons. It was is important to ensure there is a like-for-like comparison with the empirical fib Model code, which only considers the width of the web over the full section depth to resist shear. Secondly, while there are suggested ways to incorporate flanges (or parts thereof) into the effective shear area, this could potentially be open to interpretation. It becomes possible to arrive at preferential shear capacity.
It should be noted that several references have been used to calculate shear capacity. For consistency, the nomenclature from each reference has been carried forward to this paper. This does mean there are some differences in notation. For example, “V” has been used for shear when referring to the fib Model code, and “P” is the shear capacity calculated using the plastic method. Each term is described in this paper and should allow interested readers to readily access the referenced documents.
Bridge T-beams were adopted for this experiment as they are commonly used throughout Australia. The vast majority of road and rail bridges where individual spans do not exceed 40 m have these bridge T-beams. Precast manufacturers throughout Australia have facilities to produce the beams in standardized moulds. There were several reasons for developing the precast, prestressed bridge T-beams and some advantages include torsional strength, wide flanges that eliminate the need for infill panels between beams, immediate stability and provision of a safe working platform when the beam is placed on bearings and the crane is released. In the construction industry, the T-beams are also referred to as “Super-T” beams and “T-roff” beams.
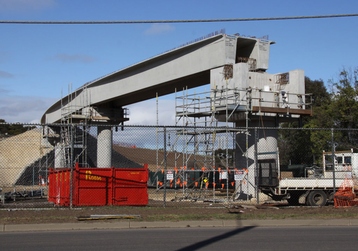 |
Figure 1: Example of a T-beam bridge under construction |
Experimental
program (bridge T-beams)
Four beams full scale were fabricated for the test program. The beams are the shallowest T-beams regularly cast in precast yards in Australia. The vast majority of T-beams vary in depth from 550 mm to 1800 mm, with a few exceptions slightly deeper than this range. For the test program, beams with a precast depth of 550 mm were used. A topping slab 80 mm thick was added. This is the thinnest topping slab that would be adopted in regular construction.
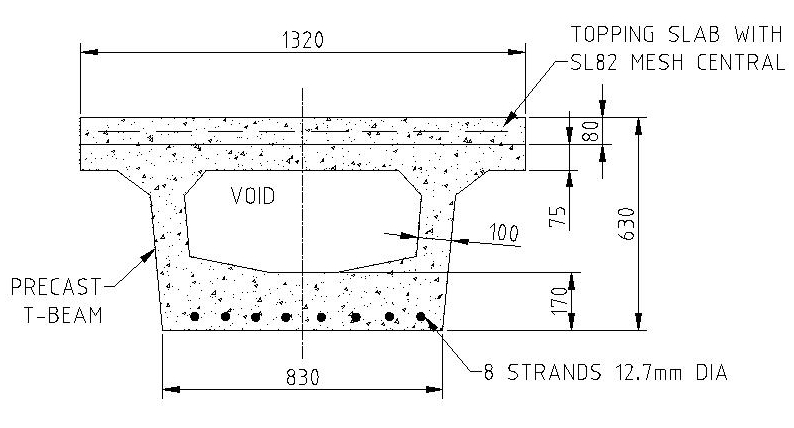
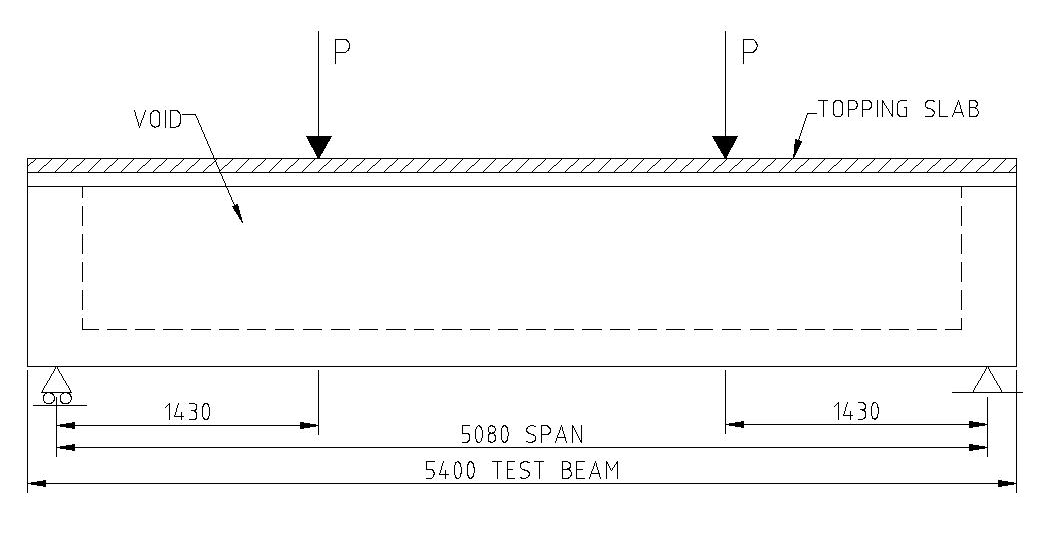
Two precast beams were fabricated with steel fiber added to the mix – 60 kg/m3 of Dramix 80/60 hook-end fiber. No vertical shear reinforcement. Two beams were fabricated as plain concrete, that is, with no steel fiber and no vertical shear reinforcement. Prestress is provided by 8 bonded 12.7 mm diameter strands. The strands were prestressed to a force of 138 kN prior to release. Transfer took place 7 days after the beams had been cast. Concrete was supplied by an external contractor and delivered to the precasting yard. Two cylinders were taken prior to the addition of steel fiber and later tested on the same day as the beam tests. The test cylinder results were 55.7 MPa and 57.3 MPa giving an average of 56.5 MPa. Steel fiber was added on site, which considerably reduced workability (slump). To bring workability back, sufficient plasticiser was added to provide a working slump estimated to be 60 mm to 70 mm.
The concrete was provided by a ready mix concrete supplier with a nominated strength grade of 50 MPa. The concrete mix design is the one used routinely by the precaster to achieve high early strength (up to 40 MPa) after 18 hours of steam curing.
| Cement content including 18% fly ash | Water content | Water reducer added at batch plant | 14 mm aggregate | Minus 5 mm crushed aggregate | Sand | Nominal slump |
| 585 kg/m3 | 195 litres per m3 | 400 to 600 ml/m3 | 1180 kg/m3 | 50 kg/m3 | 405 kg/m3 | 30 mm |
| Steel | Quantity | Properties |
| Dramix 80/60 Hook end steel fiber |
60 kg/m3 | 60 mm long, 0.75 mm diameter, minimum tensile strength 1050 MPa |
| 7-wire low relaxation prestressing strand | 8 strands prestressed to 138 kN prior to transfer | Minimal tensile strength 1840 MPa |
Retardant was sprayed on the top surface of the precast beam so that a small quantity of cement paste could be removed during curing. Approximately 48 hours after the initial cast, up to 2 mm of cement paste was removed by water pressure hosing the top surface. This was sufficient to expose the upper surface of the uppermost aggregate but not to dislodge any stones or cause disturbance to the concrete matrix.
The topping slab, to replicate conventional bridge construction, was cast onto the precast beam. The surface was prepared using a fine spray of water so that it was damp just prior to the insitu pour. The topping slab was from the same external concrete supplier and the same mix design. A central layer of conventional steel reinforcing mesh SL82 was placed in the topping slab. SL82 is a square mesh with 7.6 mm diameter bars at 200 mm centres; yield strength 500 MPa.
The main reason for selecting the smallest regular sized T-beam for testing was that a large force is required to cause shear failure. A purpose built test rig was constructed by the precaster at their premises using available materials and equipment.
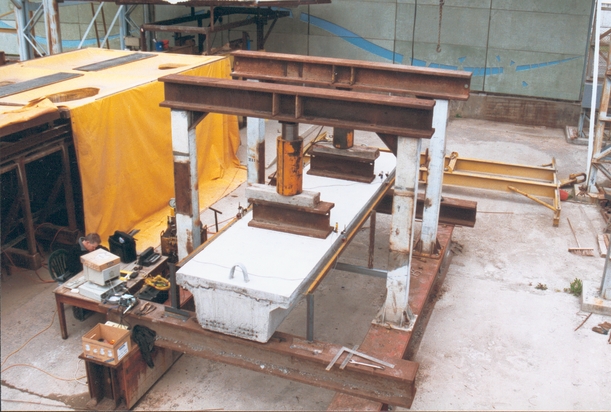
Load was applied by two 300 tonne jacks supplied by the precaster. Both jacks were calibrated by a technician under laboratory conditions. The same technician recorded load and deflection data during the tests. The technician supplied electronic displacement meters, data logger and computer to record the results. Point loads were applied as indicated on the beam elevation in figure 3. Deflections were measured at the same locations, that is, directly at the load points.
Results
The following chart shows the shear capacity achieved by each beam. The plots are shear force vs deflection measured at the load point.
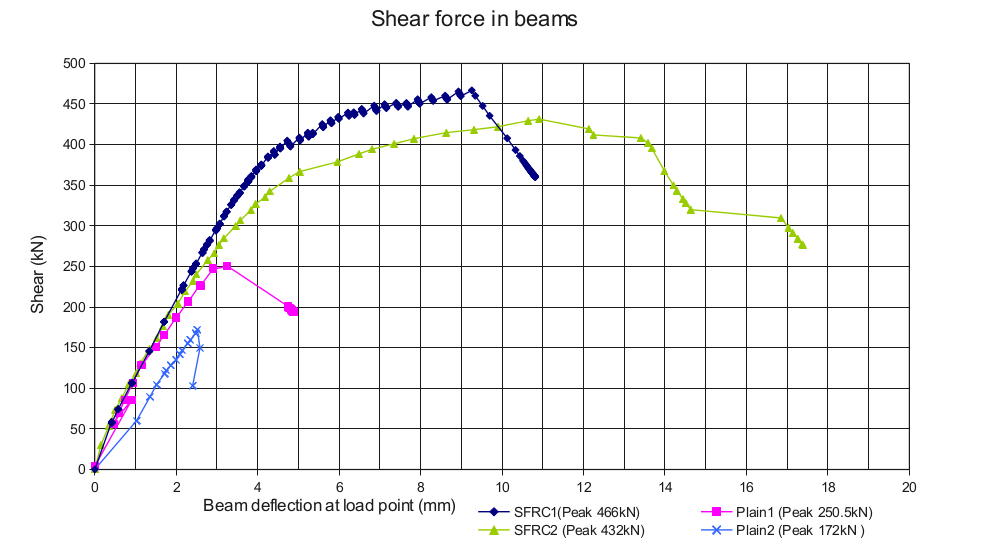
The steel fiber reinforced beams had, on average, double the shear capacity of plain concrete. Calculations in accordance with the Australian bridge code suggest this is equivalent to adding N12 vertical shear reinforcement (12 mm diameter deformed bar with yield strength 500 MPa) at 95 mm centres to the plain concrete beam.
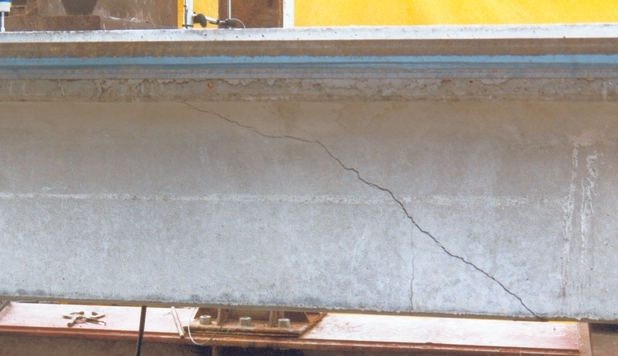
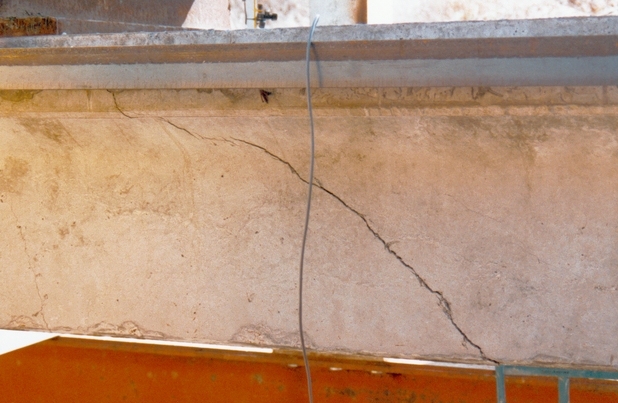
The shear failure mode of the plain concrete beams was as expected, quite abrupt with virtually no ductility. The shear crack was initiated from the beam soffit. This mode generally happens whether or not vertical shear reinforcement is present.
The SFRC beam had an unexpected ductile failure mode while holding the limit state shear force. This could be seen visually during the test. Tensile stress was transferred across several parallel shear cracks in the beam webs for a considerable time when the peak load was approached. This was due to the numerous steel fibers over a large crack area. Eventually a dominant shear crack formed in the web and then extended into the bottom flange. As soon as the dominant shear crack had formed, other cracks closed up. The final shear crack extended from the point load to the solid end block and support. Shear tests of steel fiber reinforced beams conducted by Tian Sing Ng [12] demonstrated similar failure mechanisms.
The horizontal projection of the cracks in both beams was virtually the same at 1200 mm. At full loading the top f the crack for both beams was directly under the applied load. The bottom of the crack was 230 mm from the support. The slope of the crack, from a horizontal plane (beam soffit) was 27.5 degrees. At full load, crack width varied from near zero under the point load to about 10 mm at the bottom. Crack width measurements were not taken as the crack propagation was commenced from the web then into the top and bottom flanges. The cracks closed up, due to prestress, as soon as load was removed.
There were no reinforcing bars crossing the interface between the precast and insitu topping slab. The only treatment was to deliberately roughen the precast surface, exposing about 2 mm to 5mm of the aggregate. Care was taken to ensure the aggregate was not dislodged. The surface was moistened with water just prior to insitu concrete being placed on top. The final shear failure crack was continuous through the interface, in other words, the beam acted monolithically and longitudinal shear forces were not sufficient to exceed the capacity of the topping slab bond to the precast beam.
The increased shear capacity due to steel fibres, and the ductile failure mode are similar to findings by other researchers, for example, Minelli et al. [11]
Savings when compared with conventional reinforcement
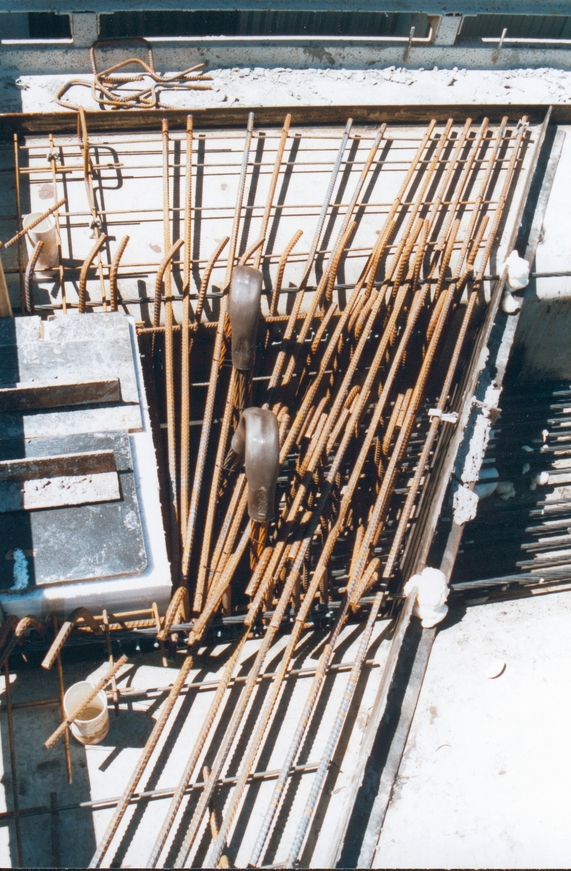
The image below shows a conventionally reinforced beam - view looking down into the mould. Note that all of the conventional reinforcing stirrups (seen here) was left out of the test beams. Only the prestressing strands (right hand side of picture) were installed.
The
stirrups shown in this conventionally reinforced beam are at 100 mm
centres in the end block and the beam has a skewed end to suit the
bridge geometry. Stirrups are at 150 mm centres towards the centre
of the beam. The end zone of the beam has double stirrups as well as
end reinforcement to resist transverse stresses.
None of this reinforcement is required when steel fibres are added
to the concrete mix. The test beams have similar shear capacity as a
beam with this amount of reinforcement.
This gives an indication of the savings available in terms of
material (stirrups and end zone reinforcement) as well as the
complexity and time savings of building and placing the
reinforcement.
Comparison with fib Model Code 2010 [5]
Shear capacity of fiber reinforced concrete beams as formulated in the fib Model code (2010) is given by:

All terms are defined in the fib Model Code.
The chart below illustrates shear capacity for a range of residual strength values. The partial safety factor has been set equal to 1.0, that is, a calculation of the limit state capacity without reductions for design purposes in order to directly compare with test results.
The model code approach requires a tension test for all concrete mixes. In time, design engineers may build a library of test results for various concrete mixes, fiber types and fiber contents, but in the meantime additional testing will be required for every application. Tension tests require equipment and technical expertise that is quite specialised when compared with simple compression testing. Even after having a library of data, it is highly likely there would be requirements for ongoing project based tension testing for quality control. These factors may be a disincentive for the use of fibers.
Based on test results from several sources, the tensile strength range using commonly available concrete strengths and workable quantities of steel fiber is likely to be between 0.5 MPa and 1.5 MPa. In this case, with 60 kg/m3 of 80/60 hook-end steel fiber the concrete mix was at the upper end of workability.

The model code calculates shear capacity based on a residual FRC tensile strength of 1.4 MPa as 264 kN, which is significantly smaller than the average capacity of 449 kN measured directly from the beam tests. The model code value is similar to the capacity measured for one of the plain concrete beams (250.5 kN). Based on this analysis the model code equation is a poor predictor of shear capacity for the fiber reinforced bridge T-beams.
Variable Engagement Model - Foster [6]
Foster (2010) suggests the Variable Engagement Model (VEM) may be adopted to calculate residual tensile strength cracked fiber reinforced concrete.
The residual tensile strength (after cracking) is calculated using the following equation (derived in papers published by Foster [6]:

Where the global orientation factor is a function of the crack opening displacement and is calculated using the following formula:

As recommended by Foster (2010), the fiber engagement coefficient was adopted for the hook-end fibers:

The fiber length lf must be less than a critical value that depends on fiber diameter, tensile strength and bond stress to the concrete matrix. An inspection of the shear crack surfaces indicated no fibers had snapped so the actual fiber length was adopted as the critical length.
σf is the aspect ratio of the fiber;
ρf is the volumetric fraction of fibers;
τb is the bond stress between the fibers and concrete matrix. This is calculated using the following formula;

Kragh-Poulsen et al [7] propose a modified crack sliding model to calculate Pu (the limit state shear force) by adapting parameters of plain concrete to fiber reinforced concrete. In addition they refer to a cracking load Pcr introduced by Zhang (1997).
The upper bound solution is obtained by;

where fc is the standard cylinder compression strength, b is the width of the web, h is depth, x is the horizontal projection of the crack and v is an effectiveness factor that takes into account strength reduction due to cracking and softening behaviour under compression. For more details refer to figure 11. Tests conducted as part of the research for the paper referenced above suggest v would be approximately 0.5 for the laboratory scale steel fiber reinforced concrete beams. Using the method described in Nielsen and Hoang [9] the effectiveness factor for the steel fiber test beams calculates to be 0.21. There is a shear strength enhancement due to prestress as it provides a confining force. The effectiveness factor v = vs.vo is modified to omit vs so that v = vo (effectively setting vs = 1).
In addition there is an enhancement factor ξ for fiber reinforced concrete suggested by Kragh-Poulsen et.al. [7] such that vfiber = ξ.v and that the enhancement based on a small set of laboratory beam results published in their paper should be in the range 1.17 to 1.25. Full scale beam tests, such as the ones in this paper, suggest this value is too small and the enhancement due to fiber is likely to be higher. During discussions, one of the authors of reference [7] suggested a value around 1.5 for full scale beams, which was adopted in the calculations.
The cracking load is found by;

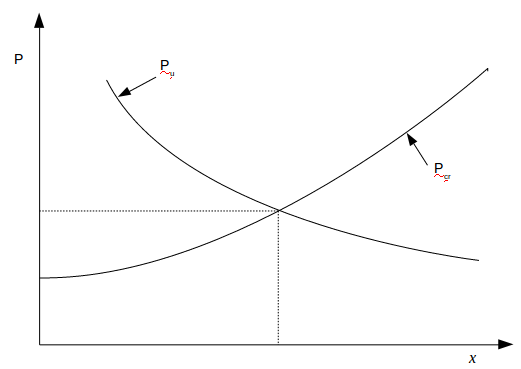
Figure 9: Cracking load Pcr and
sliding resistance Pu versus x
Direct tension experimental test results co-supervised by the author as part of another study, modified for the increased fiber content (50 kg/m3 direct tension tests versus 60 kg/m3 in the beam tests), give tensile capacity of 2.19 MPa at small crack openings.
To obtain x, and hence Pu, the equations are equated to solve for x. This results in a value of x = 998 mm, which is less than the distance from the load to the support, and Pu is calculated as 212 kN, which is less than the measured average of 449 kN. This approach needs to be modified to take into account the effect of prestress.
The effect of prestress is to lift the Pcr curve, thus resulting in a higher intersection value for P and a shorter horizontal projection for the crack length, as shown in figure 10.
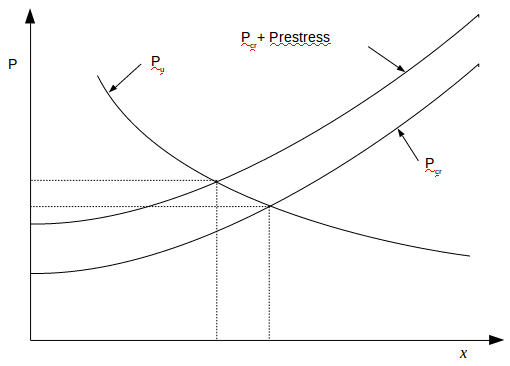
Figure 10: Modified cracking load Pcr + Prestress and sliding resistance Pu versus x
With reference Nielsen and Hoang[9], where the derivation of the equations relating to the method are explained, it can be seen that the effect of prestress can readily be included.
Ignoring prestress and taking moments about the crack initiation point at the top of the beam, the cracking moment is calculated as follows;

This can readily be seen by reference to figure 11.
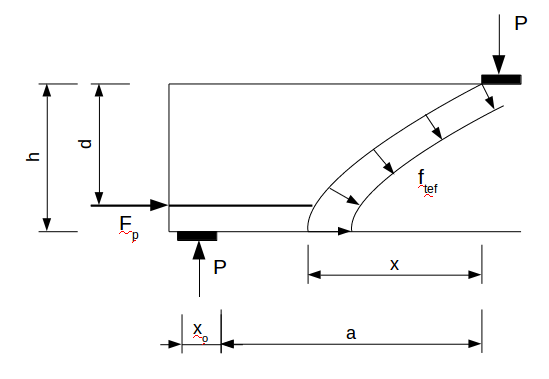
Figure 11: Stresses and forces in a cracked beam
By including prestress the cracking moment becomes;

Since;

Then;

The beam contained eight 12.7 mm diameter strands prestressed to 138 kN. They were located at an effective depth of 570 mm from the top of the beam. The strands were cast in the beam, hence bonded, and after making an allowance for losses following transfer, an effective value Fp prior to cracking can be calculated. Post-crack the value of Fp is based on the yield force of all strands as there was very little visible draw-in.
Due to the nature of the shear failure in the bridge beams, that is, a series of parallel cracks that consolidate to become one dominant crack that eventually propagates to the top and bottom of the beam, there is a high degree of confinement. The mechanism that results in a cracking moment did not eventuate and hence a cracking shear force Pcr cannot be applied to these beams. By extension, the cracking shear force probably cannot be applied the vast majority of large scale beams that have relatively thin webs due to the confinement stresses in the web compared with the flanges. The plastic method shear force is therefore based on the limit state shear force Pu calculated at the measured horizontal projection of the shear crack.
Both the plain concrete and fiber reinforced concrete beams had horizontal crack projections of around 1300 mm, which is the distance from the point load to the support. For plain concrete the calculated value for Pu is 214 kN when x = 1300 mm. This is close to the average value of 211 kN.
Similarly for the fiber reinforced concrete beams, the measured value of x around 1300 mm is adopted as before; due to compressive confinement from prestress. This resulted in a calculated value for P of 429 kN, which is close to the measured shear capacities of 432 kN and 466 kN.
Discussion
The experimental results presented demonstrate that the addition of steel fibers in prestressed concrete beams can double the shear capacity as well as reducing the scatter of the test results. The large scatter in tensile strength results of concrete is widely known. The addition of steel fibers reduces the scatter while also enhancing the tensile strength of concrete. Although with limited test results, it can be seen that the variability of shear capacity is higher in plain concrete as compared to steel fiber reinforced concrete. This reliability of the shear capacity is an important consideration in design as much as the enhancement of shear capacity.
The objective of this paper has been to compare the measured shear capacities of “real world” prestressed steel fiber reinforced concrete bridge T-beams against available methods for calculating limit state shear capacity. Two methods, one from the fib Model code 2010 and the other using a concrete plasticity approach were used for the comparison.
The fib Model code method was quite inadequate in predicting the shear capacity of these T-beams with a calculated capacity of 264 kN versus the average measured capacity of 449 kN. The fib Model code could be considered to be very conservative by a design engineer, but as the predicted value is well short of actual, it does not provide sufficient accuracy to provide a good enough understanding of the forces at work in the beam. Furthermore, the fib method is not sufficiently sensitive to the steel fiber dosage. Even with a very high dosage of fiber there is minimal calculated increase in shear capacity, which is at odds with the results from this experiment. Similar conclusions were drawn by Moreillon et al [10].
Notwithstanding the inaccuracy of the method described in the fib Model code, a modification recommended by Foster [6], the variable engagement model (VEM), has been demonstrated to provide remarkably accurate information about the residual tensile capacity of fiber reinforced concrete at various crack openings. There is merit in embedding the VEM approach in further development relating to structural capacity of fiber reinforced concrete.
Concrete plasticity provided a predicted capacity significantly closer to the measured values. The method described in a paper by Kragh-Poulsen et al [7] which draws heavily on the work of Zhang [8] was modified to incorporate the effect of prestress. The predicted value of 429 kN compared with the average measured value of 449 kN gives confidence that this method may provide a more accurate understanding of the forces. As this method seems to be more accurate, further research is required in finding the key links between basic fiber characteristics and parameters required for the plastic method. There are some anomalies that need further investigation. Fiber characteristics derived from assessments such as direct tension tests, fiber pull-out tests, and fracture mechanics, will be helpful in bringing greater confidence to the shear effectiveness factor, fiber effectiveness as well as enhancement factor and direct tension capacity.
Traditionally, shear calculation methods (including the two in this paper) have relied only upon the width of the web. With reference to the section shown in figure 2, it is possible to envisage shear contribution from the flanges. However, a notional increased shear area is not recommended as it may be open to interpretation. In any case, relying on the web alone (for calculation purposes) seems to provide sufficient accuracy.
The plastic approach used in this paper has one significant short-coming. It can only be applied to a beam with one or two point loads as the shear crack location must be known and in this scenario the shear crack will always coincide with point load. Furthermore, the horizontal projection of the crack must also be known. These beam tests indicate the horizontal projection will always be the distance between the point load and support when the point load is applied within a notional distance up to 3.5d, where d is the effective depth. The method will require further investigation and development before it can be incorporated in design guides and model codes for beams with variable distributed and point loads.
| Beam | Test Results | fib Model Code | Plastic Method |
| Plain 1 - no steel fibers added | 250 kN | 208 kN | 214 kN |
| Plain 2 - no steel fibers added | 172 kN | 208 kN | 214 kN |
| SFRC 1 - steel fibers added 60 kg/m3 | 466 kN | 264 kN | 429 kN |
| SFRC 1 - steel fibers added 60 kg/m3 | 432 kN | 264 kN | 429 kN |
Conclusions
-
The addition of steel fibers at the dose rate of 60 kg/m3 in concrete was found to enhance the shear capacity by 112% on average in the full scale bridge beams tested.
-
The fib Model code prediction estimates an enhancement of 26% which is far short of the 112% found in the experimental results. The model used in the fib Model code is not sufficiently sensitive to the steel fiber addition. It is possible that the model was developed based on laboratory scale tests and lacks the ability to accurately estimate the results of full scale bridge beams due to scale effects.
-
The Plastic Design method accurately estimates the shear capacity of the full scale beams and is sensitive to the steel fiber addition. This method can be potentially adopted in design guides with further research and confirmation. However it was limited in this case as the location and angle of the crack had to be known for the calculations.
-
The Variable Engagement Model accurately predicts the residual tensile strength of steel fiber reinforced concrete.
Acknowledgements
The authors are grateful to Professors Linh Hoang and M.P. Nielsen from the Technical University of Denmark for hosting the author as a visitor for valuable discussions and clarifying the issues on Plastic Design approach. The authors are also grateful to Professor Stephen Foster for the discussions and introduction to the Variable Engagement Model.
References
1. Parra-Montesinos, G. J., “Shear Strength of Beams with Deformed Steel Fibers”, Concrete International, V. 28, No.11, Nov 2006, pp 57-66.
2. Aoude, H., Belghiti, M., Cook, W. D., Mitchell, D., “Response of Steel Fiber-Reinforced Concrete Beams with and without Stirrups” ACI Structural Journal, May-June 2012.
3. Minelli. F., “Plain and Fiber Reinforced Concrete Beams under Shear Loading: Structural Behaviour and Design Applications” PhD thesis, Department of Civil Engineering, University of Brescia, StarrylinkEditrice, Brescia, Italy, 2005.
4. Minelli, F., and Plizzari, G. A., “Steel Fibers as Shear Reinforcement for Beams”, Proceedings of the Second International fib Congress, Naples, Italy, 2006.
5. fib Model Code 2010 – Final draft, Volumes 1 and 2, available as fib Bulletins 65 and 66.
6. Foster, S., “Design of FRC beams for shear using the VEM and the draft Model Code approach”, fib Bulletin 57: Shear and punching shear in RC and FRC elements, October 2010, pp 195-210.
7. Kragh-Poulsen, J., Hoang, L. C., Goltermann, P., “Shear capacity of steel and polymer fiber reinforced concrete beams”, Materials and Structures, Volume 44, Issue 6, July 2011, pp 1079-1091.
8. Zhang, J. P., “Diagonal cracking and shear strength of reinforced concrete beams”, Magazine of Concrete Research, Volume 49, Issue 178, March 1997, pp 55-65.
9. Nielsen, M. P., Hoang, L. C., “Limit Analysis and Concrete Plasticity”, Third Edition, 2011, ISBN 978-1-4398-0396-7.
10. Moreillon, L., Nseir, J., Suter, R., Le Roy, R., “Shear strength of pre-tensioned members in high strength fibre reinforced concrete”, 8th RILEM International Symposium on Fibre Reinforced Concrete, 2012.
11. Minelli, F., Giovanni, A.P., “Shear strength of FRC members with little or no shear reinforcement: a new analytical model” fib Bulletin 57: Shear and punching shear in RC and FRC elements, October 2010, pp 211-225.
12. Sing Ng, T., “An investigation into the development of high performance geopolymer concrete” PhD Thesis, University of New South Wales, August 2011.
13. Meda, A., Minelli, F., Plizzari, G.A., Riva, P., “Shear behaviour of steel fibre reinforced concrete beams”, Materials and Structures 38 (April 2005) pp 343-351.
14. Gustafsson, J., Noghabai, K., “Steel fibers as shear reinforcement in high strength concrete beams”, Luleå University of Technology, Sweden.
15. Spinella, N., “Shear strength of full-scale steel fibre-reinforced concrete beams without stirrups”, Computers and Concrete, Vol 11, No. 5 (2013) pp 365-382.
16. Mondo, E., “Shear capacity of steel fibre reinforced concrete beams without conventional shear reinforcement”, MSc Thesis, Royal Institute of Technology (KTH), Sweden (2011).
Research Initiatives