
I
Shear Capacity using Fracture Mechanics
Introduction
Fracture mechanics is an area that holds promise for fibre reinforced concrete. The addition of fibre alters the post-crack behaviour so that fracture mechanics can be applied in a meaningful way. It is an area of ongoing interest and research and can be applied not only to shear but also to torsion and bursting forces. This web-page will be updated as more research comes to hand. The areas of particular interest are:
- The nature of shear in concrete as pure shear is rarely encountered in real world structures
- Relationship of concrete matrix tension and fibre pullout for various types of fibres and concrete mixes, and how that relates to post crack fracture behaviour
Concrete and fracture mechanics
Fracture mechanics is a well known approach for relatively homogeneous materials such as steel. Extensive literature and examples based on decades of research are available for these materials. There have been many attempts to include concrete in the family of materials where fracture mechanics is applicable. From a practitioners point of view, they have largely been unsuccessful due to the post-crack behaviour of concrete. As a very brittle material concrete has minimal post-crack strength. Structural capacity calculations (such as shear, torsion, and bending) are written into design codes around concrete in tension being cracked and offering no strength.
Fibres supplied by manufacturers for general use in the construction industry can arrest and re-distribute cracking stresses in concrete. It is important to note that fibres do not prevent cracking. Fibres at workable dosages are effective when concrete tensile stresses reach and exceed the tensile capacity of concrete. This far, there are no fibres available on the market for general use, in workable quantities and economically competitive that can prevent cracking. Therefore current “state of the art” fibres cannot replace primary bending tensile reinforcement. Nevertheless there is ongoing development in this area, and research suggests specific types of structures may lend themselves to having fibre replacement of bending reinforcement.
Fibres are very useful in applications where tensile stresses are indirectly generated. They significantly improve ductility and deformation capacity of plain concrete. Examples include shear, torsion and bearing. In this paper, shear will be used as an example where fracture mechanics provides a theoretical framework and a new approach resulting in a successful design tool. These tools can be broadened to include torsion, bearing and other areas.
Current practice
There are design guides available to assess shear capacity of steel fibre reinforced concrete sections. They have generally been developed by fibre manufacturers and promulgated into some design codes in other countries.
The design capacities are almost entirely based on testing and empirical relationships based on test results. This is not dissimilar to the way in which conventional shear design has been developed. Design codes used for calculating shear capacity using traditional means have a semi-empirical component.
Design shear capacities using steel fibre that result from empirically based design guides tend to be very conservative.
Fracture Mechanics
Fracture energy Gf can be determined for any material providing the post-crack tension behaviour is understood. A parameter, characteristic length lch , can be derived from the fracture energy. Hillerborg [1] invented the characteristic length defined as:

It has the following physical meaning: If a sample is under uniaxial tension and the material has a linear softening curve, the maximum length for getting stable fracture under displacement control over this length is equal to twice the characteristic length. This can be shown by comparing fracture work and elastic energy in a sample.
Shear capacity model
Work by Gustaffson [2] and Hillerborg [3] indicates a dependency of shear capacity on the tensile strength of concrete ft , beam depth d, the reinforcement ratio ρ, span to depth ratio, and the characteristic length lch . This also seems intuitively correct as shear cracks are the result of indirect tension stresses.
Steel fibres enhance the toughness of
concrete and it is possible to postulate a relationship between
shear capacity and characteristic length. Hillerborg suggested a
dependency of shear upon characteristic length as shown in the
following equation:

With a tri-linear stress-displacement model (or softening curve) it is possible to calculate Gf and lch for steel fibre reinforced concrete. With these parameters a proportional function can be developed to calculate ultimate shear capacity.
Zink [4] developed a proportional function kG that correlated well with 233 test results on conventionally reinforced and prestressed concrete sections where:

A tri-linear softening curve (refer to figure 1) has been adopted to model concrete matrix behaviour when the concrete matrix passes through peak stress capacity. A bi-linear curve could also be adopted, however available test data suggests a tri-linear curve offers the “best fit”. Four points on the tri-linear softening curve are defined based on test data. They will be derived in detail below, however referring to the chart below, in summary :
- Point 1 represents the initial tensile stress limit of the concrete mix
- Point 2 is reached at very small and somewhat diffuse crack openings (micro-cracking) of 50 μm. Until this point, only concrete is resisting tensile stress as the small proportion of fibre has negligible effect. Steel fibres begin to be mobilised after micro-cracking has commenced.
- Point 3 is considered to be a crack opening dimension of 200 μm where concrete no longer contributes to tensile capacity. The contribution by concrete to tensile strength between 2 and 3 is small. Points 2 and 3 are separated by only 150 μm.
- Point 4 is somewhat arbitrary, but is conservatively selected to be less than the opening at which the fibres would be effective. It should be no greater than 15 mm.
Shear capacity of SFRC based on fracture mechanics
Fracture energy and characteristic length
Fracture energy Gf
Characteristic length lch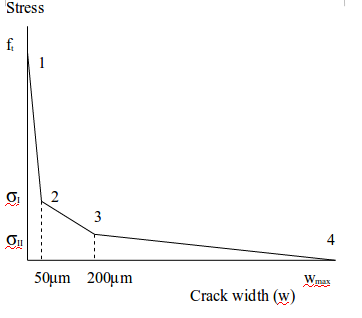
| Crack
width range |
Note |
| 0 to 50 μm | Concrete only |
| 50 μm to 200 μm | Concrete and fibre |
| 200 μm to wmax | Fibre only |

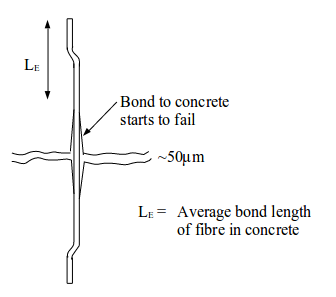
Fibres cross cracks randomly. Cracks can intersect fibres at mid-length or any other portion of the fibre length. Therefore adopt an average bond length
LE = 0.25 x length of fibre
Proportion of tension capacity due to concrete :

- w1 is defined as 50 μm (0.05 mm)
- w2 is the crack beyond which concrete makes no further contribution to tensile capacity ~200 μm (0.2 mm)
- ft2 is tensile capacity of concrete at crack width 50 μm due to aggregate interlock.
- ~0.7 MPa for concrete with gravel
- ~0.85 MPa for concrete with crushed rock
Proportion of tension capacity due to fibre:

Where:
- 0.3 is a measure of fibre effectiveness due to 3-D orientation
- ηVOL is the steel fibre proportion of the matrix (volume)

- η is steel fibre dosage kg/m3
- ρs is density of steel 7850 kg/m3
- στ is fibre stress at bond failure (pullout)

therefore:

where:

and:

Where bond strength depends on concrete strength. The following relationship is suggested based on limited tests of hook-end fibres. Note there is further work being done to better understand the relationship of fibre pullout with the softening curve (post-crack).

where fc = concrete strength
The effectiveness (and efficiency) of steel fibres depends on concrete strength, fibre aspect ratio, dosage and pull-out strength. This is not unexpected and aligns with the numerous and varied tests conducted by fibre manufacturers. These key variables can be adjusted either during manufacture or construction of fibre reinforced concrete structures. Fibre bond strength, which is based on individual fibre pull-out tests, is highly dependent on the fibre type (hook-end, spade-end, twisted, etc), fibre strength and concrete strength.
Calculate
point 3
Fibre alone provides tensile capacity.

Calculate point 4
For consistency, can adopt an approach that all steel fibres are pulled out of the matrix when :

however, in reality there will still be some fibres, less than half the dosage (say) that would be holding load. This will also depend on fibre type. Some fibres snap the end anchorage and easily slide out with very little residual capacity. Spade-end fibres have sufficient strength to work their way through the cement paste, deforming as they progress, and continue to hold considerable load. Hook-end fibres have sufficient strength to “un-kink” the hook-end during pull-out, but once the fibre has withdrawn past the last bend it has very little residual strength.
For these reasons, and because the final value of wmax beyond a certain value has little effect on the calculation of Gf, wmax can be a range of values. A conservative range would be :
0.15.lfibre < wmax < 0.25.lfibre
For the purpose of calculating shear capacity, one could adopt a crack width that reflects a best “guess” beyond which shear is no longer viable. This is highly likely to depend on aggregate type and size and requires more research.
Fracture energy
Fracture energy Gf is the area under the softening curve. Characteristic length lch is calculated as follows :

Shear capacity
Shear capacity Vs can be calculated using an expression with area above the neutral axis, average tensile stress at the limit state and a multiplier effect based on the fracture zone where:

Where:

and:

Comparison with code design approach
The benefit of steel fibre and a fracture mechanics approach can best be illustrated using the stress diagrams shown in the following figure. Code design equations typically rely only on the uncracked part of the section above the neutral axis.
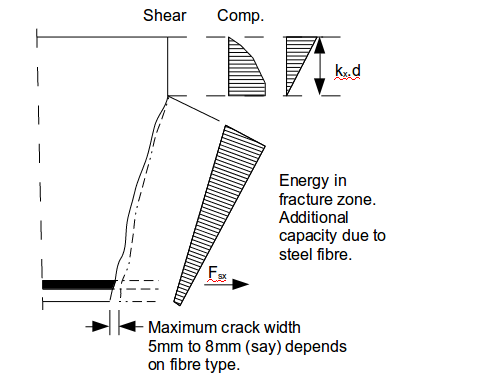
The shear and compressive stress diagrams above the neutral axis are in accordance with code design methods. Bottom reinforcement is in tension and the section is assumed to be cracked from the bottom fibres up to the neutral axis. With the addition of steel fibres the section will have additional shear capacity through the cracked zone.
Full scale beam tests
Precast prestressed concrete T-beams commonly used in bridge structures throughout Australia were tested by the author some years ago. They were 650mm overall depth with 100mm thick side webs and included 60kg/m3 of hook-end steel fibres. T-beams often have large quantities of shear reinforcement near the ends. The reinforcing cages are difficult to assemble and install in the mould. Manufacturers, despite best efforts, have long been concerned about design risks. The aggregate tends to bridge over multiple layers of closely spaced reinforcement and with intense compaction some segregation is thought to occur such that paste eventually fills the bottom cover zone. This would lead to longer term concerns about durability.
Experimental
program (bridge T-beams)
Four beams full scale were fabricated for the test program. The beams are the shallowest T-beams regularly cast in precast yards in Australia. The vast majority of T-beams vary in depth from 550 mm to 1800 mm, with a few exceptions slightly deeper than this range. For the test program, beams with a precast depth of 550 mm were used. A topping slab 80 mm thick was added. This is the thinnest topping slab that would be adopted in regular construction.
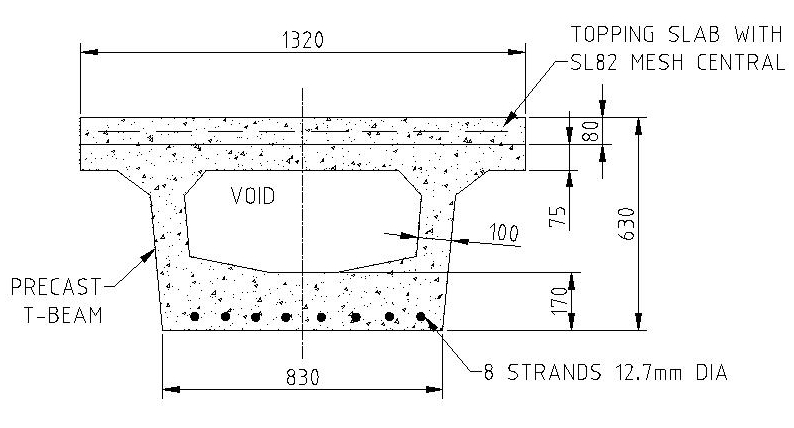
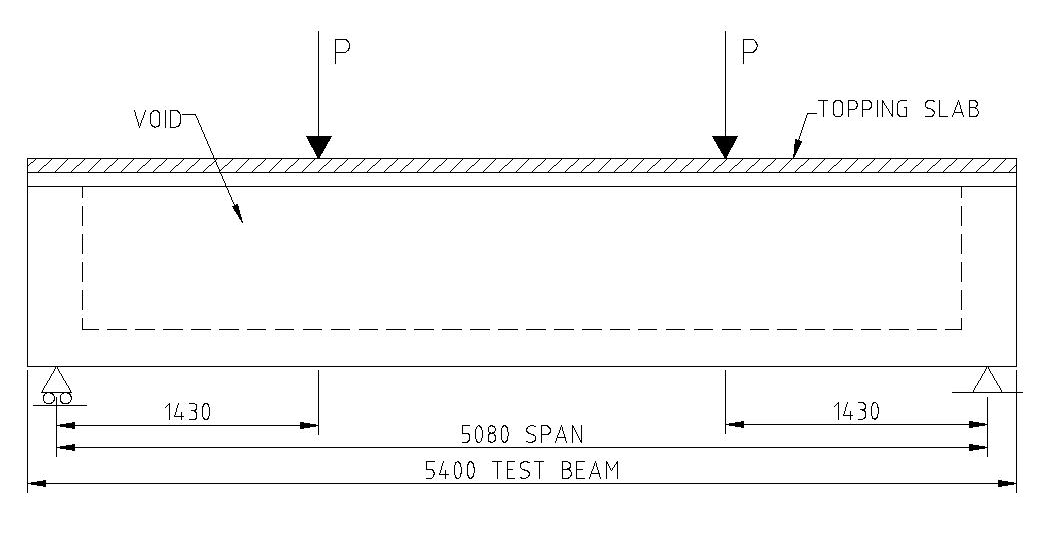
Two precast beams were fabricated with steel fiber added to the mix – 60 kg/m3 of Dramix 80/60 hook-end fiber. No vertical shear reinforcement. Two beams were fabricated as plain concrete, that is, with no steel fiber and no vertical shear reinforcement. Prestress is provided by 8 bonded 12.7 mm diameter strands. The strands were prestressed to a force of 138 kN prior to release. Transfer took place 7 days after the beams had been cast. Concrete was supplied by an external contractor and delivered to the precasting yard. Two cylinders were taken prior to the addition of steel fiber and later tested on the same day as the beam tests. The test cylinder results were 55.7 MPa and 57.3 MPa giving an average of 56.5 MPa. Steel fiber was added on site, which considerably reduced workability (slump). To bring workability back, sufficient plasticiser was added to provide a working slump estimated to be 60 mm to 70 mm.
The concrete was provided by a ready mix concrete supplier with a nominated strength grade of 50 MPa. The concrete mix design is the one used routinely by the precaster to achieve high early strength (up to 40 MPa) after 18 hours of steam curing.
| Cement content including 18% fly ash | Water content | Water reducer added at batch plant | 14 mm aggregate | Minus 5 mm crushed aggregate | Sand | Nominal slump |
| 585 kg/m3 | 195 litres per m3 | 400 to 600 ml/m3 | 1180 kg/m3 | 50 kg/m3 | 405 kg/m3 | 30 mm |
| Steel | Quantity | Properties |
| Dramix 80/60 Hook end steel fiber |
60 kg/m3 | 60 mm long, 0.75 mm diameter, minimum tensile strength 1050 MPa |
| 7-wire low relaxation prestressing strand | 8 strands prestressed to 138 kN prior to transfer | Minimal tensile strength 1840 MPa |
Retardant was sprayed on the top surface of the precast beam so that a small quantity of cement paste could be removed during curing. Approximately 48 hours after the initial cast, up to 2 mm of cement paste was removed by water pressure hosing the top surface. This was sufficient to expose the upper surface of the uppermost aggregate but not to dislodge any stones or cause disturbance to the concrete matrix.
The topping slab, to replicate conventional bridge construction, was cast onto the precast beam. The surface was prepared using a fine spray of water so that it was damp just prior to the insitu pour. The topping slab was from the same external concrete supplier and the same mix design. A central layer of conventional steel reinforcing mesh SL82 was placed in the topping slab. SL82 is a square mesh with 7.6 mm diameter bars at 200 mm centres; yield strength 500 MPa.
The main reason for selecting the smallest regular sized T-beam for testing was that a large force is required to cause shear failure. A purpose built test rig was constructed by the precaster at their premises using available materials and equipment.
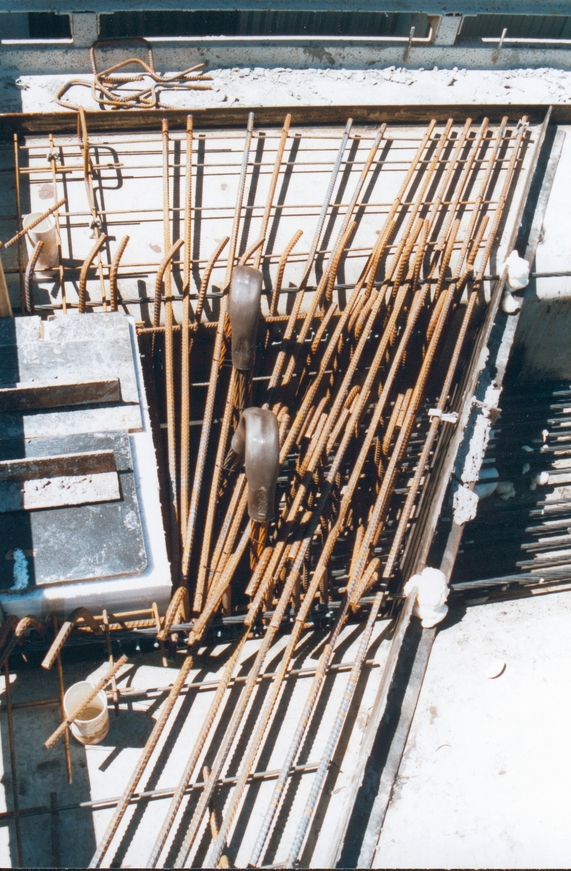 |
Savings compared with reinforcing barsConventionally reinforced beam - view looking down into the mould. Note that all of the conventional reinforcing stirrups (seen here) was left out of the test beams. Only the prestressing strands (right hand side of picture) were installed.The stirrups shown in this conventionally reinforced beam are at 100 mm centres in the end block and the beam has a skewed end to suit the bridge geometry. Stirrups are at 150 mm centres towards the centre of the beam. The end zone of the beam has double stirrups as well as end reinforcement to resist transverse stresses. None of this reinforcement is required when steel fibres are added to the concrete mix. The test beams have similar shear capacity as a beam with this amount of reinforcement. This gives an indication of the savings available in terms of material (stirrups and end zone reinforcement) as well as the complexity and time savings of building and placing the reinforcement. |
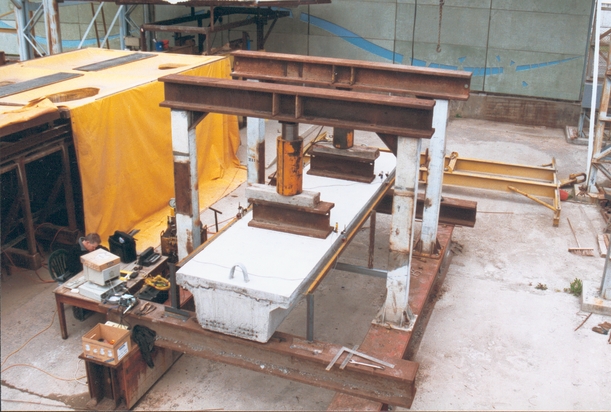 |
Test rig with 300 tonne loading jacks |
Control beams (plain concrete with no conventional reinforcement) were compared with steel fibre reinforced beams. The lower two graphs in figure 6 are plain concrete and indicate approximately half the capacity of steel fibre reinforced concrete as well as an abrupt failure. The steel fibre reinforced concrete, as well as having much higher shear capacity, also demonstrates good ductility at the limit state shear load.
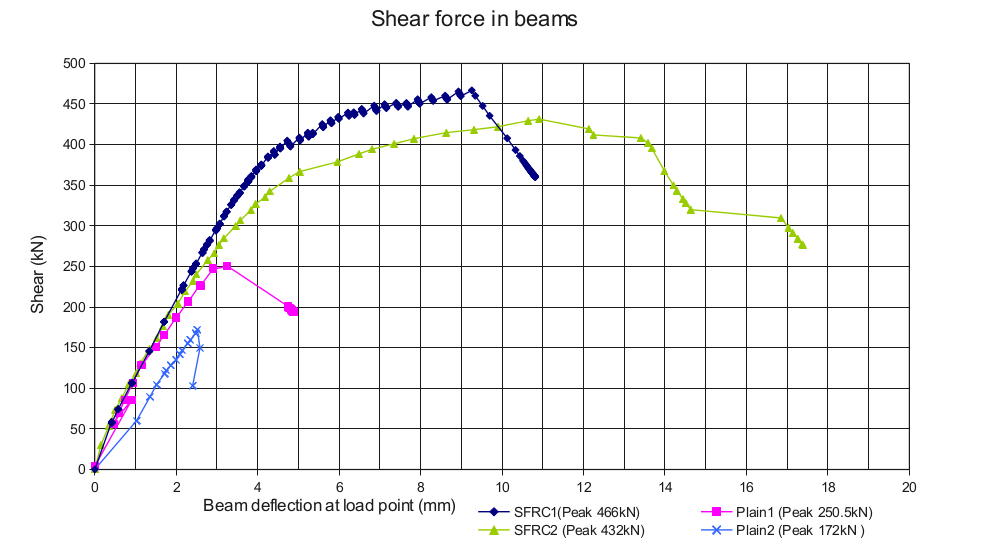
The above figure shows a comparison of steel fibre reinforced T-beams and plain concrete T-beams.
Other test beams
Tests were also conducted on wide “band-beams” commonly used in buildings. The beams are part of a precast concrete system developed by the author. The test beams were 1200mm wide and 400mm deep and included 50kg/m3 of hook-end steel fibres in the concrete mix.
At Victoria University in Australia there have been a number of student projects over the last several years. One of the earlier projects was to test small SFRC beams. Over-reinforced with conventional bars to ensure shear failure. Three square section (180mm x 180mm) beam types were made. Plain concrete control beams, spade-end fibre beams and hook-end fibre beams.
Test
results
are compared in the table below with the calculated capacity based
on the fracture mechanics approach. Fracture mechanics predictions
are close to actual test results, except for the Victoria University
test beams where dowel action was significant, and not accounted for
in the calculation, and possibly a size effect.
| Fracture mechanics | Test results (average) | |
| T-beams | 427 kN | 449 kN |
| Wide band beams | 918 kN | 971 kN |
| Vic Uni test beams | 193 kN | 267 kN |
Conclusion
Fracture mechanics can be successfully applied to steel fibre reinforced concrete and this paper has presented a design tool based on this approach. Several projects have been completed using fracture mechanics calculations. This paper has focussed on shear capacity as an example but there are many more applications for the method.
Even though research has been confined to steel fibres, recent tests suggest that synthetic fibres may also be suitable for a fracture mechanics approach. Over the years a wide variety of fibres from different manufacturers have been tested. This has enabled a good understanding of the characteristics that are desirable for effective steel fibres. Testing is ongoing through a collaborative research programs where several techniques have been developed to provide necessary parameters such as fibre pull-out strength that are required for a fracture mechanics approach.
References
[1] Analysis of crack formation and crack growth in concrete by means of fracture mechanics and finite elements. A. Hillerborg, M. Modeer, P.E. Petersson, Cement and Concrete research 6 (1976)
[2] Fracture mechanics studies of non-yielding materials like concrete. P.J. Gustafsson. Report TVBM-1007, Div. of Building Materials, Lund Institute of Technology, 1985.
[3] Shear strength of reinforced concrete beams. A. Hillerborg. Application of fracture mechanics to reinforced concrete, Carpintiri (ed.), pp 487-501, London 1990.
[4] Diagonal shear cracking in slender concrete beams. M. Zink, University of Leipzig, 2000.
Research Initiatives